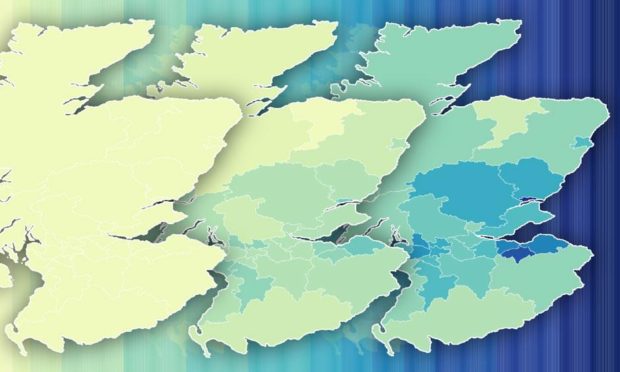
Covid case rates are increasing exponentially in Scotland. We take a look at how these rates have changed across Tayside and Fife over time, going back to the start of the pandemic.
We’ve put together animated maps which help to put the current case rates into context. Click play on them to see the complete timeline.
By local authority area, Dundee City currently has the highest seven day case rate per 100,000 populatio. The map below shows how the distribution has changed over time.
For a more localised picture we analysed date from Public Health Scotland which shows the rates in smaller neighbourhood areas.
Dundee
Case rates are high throughout Dundee, with West Ferry being the only area to have a rate of less than 500 per 100,000 people.
On the opposite end of the scale, Whitfield currently has a case rate of 1738 per 100,000, which is the highest rate in Scotland.
Angus
Rates in Angus are generally much lower than neighbouring Dundee, however the highest rate is seen in one of the neighbourhoods next to the Dundee boundary – South Angus.
Cases in this area are currently sitting at 999 per 100,000 people. The lowest rates are seen in the Angus Glens.
Fife
Fife is currently showing quite a varied scale of rates, with the area of Elie Colinsburgh and Largoward having so few cases the rate has been suppressed by Public Health Scotland.
Rates are north of 1000 in the Cowdenbeath and Hill of Beath areas. The highest current rate is in Lochgelly East which has a rate of 1326 per 100,000 people.
Perth and Kinross
Similarly to Angus, the area with the highest rate in Perth and Kinross is also one of the neighbourhoods closest to the Dundee boundary.
Errol and Inchture shows the highest rate at 968 per 100,000 people. Whereas Blairgowrie East has the lowest current rate at 100 cases per 100,000 people.
