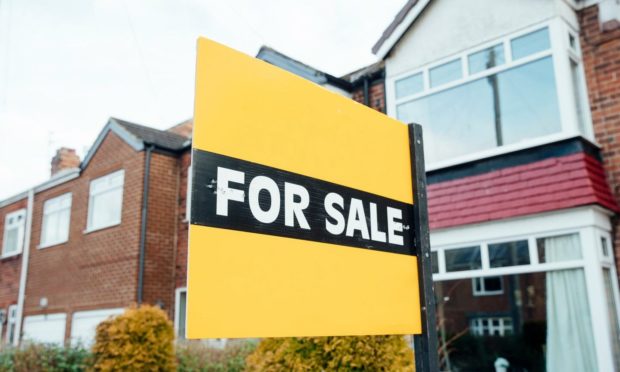
House prices in Dundee and Perth are among the top 10 most affordable of any city in the UK.
The study by Halifax shows that the average house will set a buyer back nearly six times their average earnings in Dundee, and five-and-a-half times earnings in Perth.
That is below the UK average of more than eight times average annual pay.
In Perth, the average house costs £203,229 – with average earnings standing at £36,700.
Meanwhile in Dundee, the average pay is £31,344 – and property will typically set a buyer back £181,150.
Affordability of city living worsening
Overall there has been a 10.3% surge in house prices over the last year, with the affordability of city living worsening.
However, cities still tend to be marginally more affordable than the UK as a whole, which has a house price-to-earnings ratio of 8.5.
Wages in cities are often higher than in rural areas, and during the coronavirus pandemic many city dwellers have relocated to the countryside, helping to push up house prices there.
Russell Galley, managing director, Halifax, said: “Affordability is significantly better in the north and there are now just two cities – Plymouth and Portsmouth – with better than average affordability in the south.”
Most affordable cities
Price-to-earnings ratio followed by the average house price and average annual earnings:
1. Londonderry, Northern Ireland, 4.7, £155,917, £33,138
=2. Carlisle, North, 4.8, £163,232, £34,087
=2. Bradford, Yorkshire and the Humber, 4.8, £164,410, £34,219
=4. Stirling, Scotland, 5.4, £208,927, £38,744
=4. Aberdeen, Scotland, 5.4, £205,199, £38,016
=4. Glasgow, Scotland, 5.4, £196,625, £36,205
7. Perth, Scotland, 5.5, £203,229, £36,700
=8. Inverness, Scotland, 5.6, £191,840, £34,373
=8. Hull, Yorkshire and the Humber, 5.6, £156,424, £27,730
10. Dundee, Scotland, 5.8, £181,150, £31,344
11. Sunderland, North, 6.0, £179,567, £29,745
12. Lisburn, Northern Ireland, 6.1, £203,386, £33,138
=13. Salford, North West, 6.2, £211,903, £34,444
=13. Durham, North, 6.2, £196,274, £31,762
=13. Liverpool, North West, 6.2, £215,741, £34,911
=13. Belfast, Northern Ireland, 6.2, £205,228, £33,138
=13. Lancaster, North West, 6.2, £217,392, £35,004
18. Newcastle-upon-Tyne, North, 6.3, £229,434, £36,212
19. Stoke-on-Trent, West Midlands, 6.5, £200,161, £30,698
20. Hereford, West Midlands, 6.6, £316,929, £48,048
Least affordable cities
Price-to-earnings ratio followed by the average house price and average annual earnings:
1. Winchester, South East, 14.0, £630,432, £45,059
2. Oxford, South East, 12.4, £486,928, £39,220
=3. Truro, South West, 12.1, £356,788, £29,558
=3. Bath, South West, 12.1, £476,470, £39,508
5. Chichester, South East, 10.6, £446,899, £37,352
6. Cambridge, East Anglia, 11.9, £482,300, £40,492
7. Brighton and Hove, South East, 11.6, £449,243, £38,737
8. London, South East, 11.0, £564,695, £51,257
=9. St Albans, South East, 10.2, £604,423, £59,391
=9. Chelmsford, South East, 10.2, £424,690, £41,781
11. Salisbury, South West, 10.0, £392,355, £39,154
12. Exeter, South West, 9.9, £323,554, £32,635
13. Leicester, East Midlands, 9.7, £279,080, £28,725
14. Norwich, East Anglia, 9.4, £306,946, £32,632
15. Bristol, South West, 9.3, £346,902, £37,357
=16. Southampton, South East, 9.0, £310,435, £34,429
=16. Canterbury, South East, 9.0, £365,168, £40,565
=16. Gloucester, South West, 9.0, £287,600, £31,987
19. Worcester, West Midlands, 8.8, £303,132, £34,389
20. Cardiff, Wales, 8.7, £276,851, £31,946


