Dundee United are licking their wounds following a disastrous relegation from the Premiership.
It was a campaign littered with porous defending and ineffective attacking, with many of the Tangerines’ failings patently clear as they careered towards the Championship.
However, Courier Sport has delved a little deeper and, with the help of StatsBomb, has analysed the most illustrative data behind a season to forget for the Terrors.
Records falling
The numbers that will live longest in the memory are the records smashed during the 2022/23 campaign.
The Tangerines succumbed to their heaviest ever league defeat when they lost 9-0 against Celtic in August, the result that cost Jack Ross his job.
Their 7-0 capitulation against AZ Alkmaar in the Netherlands equalled the largest reverse for a Scottish team in Europe, matching the collapses endured by Celtic against Barcelona (2016) and Hibs at home to Malmo (2013).
United’s 81 goals conceded in all competitions is their most porous tally in more than 50 years.
Passive defence
United’s defensive metrics — beyond the rather obvious “goals against” column — tell the story of a passive team, lacking fight.
StatsBomb’s “Aggression” category measures “the proportion of an opponent’s pass receipts that are tackled, fouled or pressured within two seconds”. The Tangerines tally of 0.15 per 90 minutes (p/90) is the lowest in the division.
“Pressure Regains” measures the amount of times possession is won within five seconds of the opposition being pressed. Only Livingston have a worse total than the Terrors’ total of 20.61 p/90.
“Aggressive Actions” — tackles, pressure events and fouls recorded within two seconds of an opposition ball receipt — sees United on 72.74 p/90. That is more than Celtic, Rangers and Hearts, but those are sides that often dominate possession.
A more relevant comparison would be with Kilmarnock (86.53), St Mirren (85.11) and St Johnstone (82.84).
StatsBomb also tracks PPDA (passes/defensive action), measuring how many passes a team allows before making any defensive action — a tackle, interception or foul. The Terrors allow 10.50 p/90, the third-most in the Premiership.
Their non-penalty xG (expected goals) against was 1.47 p/90, unsurprisingly the worst in the Premiership, as they went on to ship 70 league goals.
Ineffective attacking and set pieces
The Tangerines’ non-penalty xG was 0.81 p/90 and they registered, on average, just 1.32 clear shots p/90.
Only Livingston notched fewer, on both counts.
United’s “Deep Completions” — successful passes within 20 metres of the opposition goal — stood at 2.84 p/90, the joint-lowest in the division.
Inefficiency from set pieces has been another theme amid the Tannadice club’s impotence in the final third.
The Tangerines scored just ONE goal from a corner-kick in the Premiership — Charlie Mulgrew’s diving header against Ross County in December, the lowest in the division by a distance.
A diving header to remember
Charlie Mulgrew made his mark in the December meeting#cinchPrem | 🍊 #UTDRSC 🦌 pic.twitter.com/Jhj4JlP6Tt
— SPFL (@spfl) May 12, 2023
Hearts, with four, were the only side to come close.
Factoring in every form of set piece except penalties, United rippled the net four times — an average of 0.11 p/90. Hearts (0.18) and Livingston (0.21) were the only clubs to be similarly wasteful.
The Goalkeepers
The eye test is fairly damning.
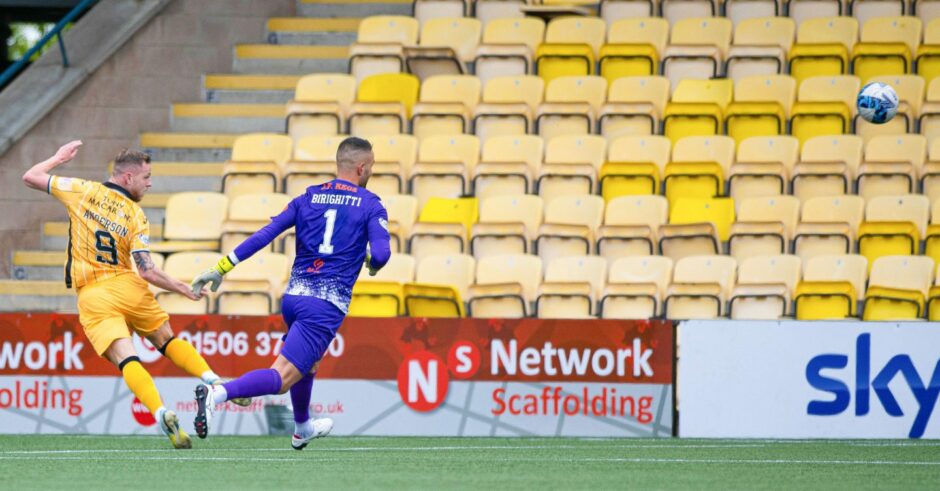
Mark Birighitti made a string of blunders, the most egregious of which was his dallying on the goal-line to allow Stevie May to slide home the winning goal for St Johnstone in February.
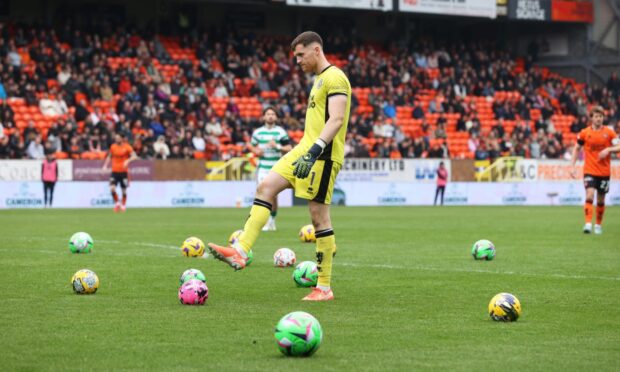
Carljohan Eriksson also appeared unconvincing, struggling with the physicality of the Scottish Premiership.
Jack Newman has only played three games and is a young stopper so it would be unfair to make sweeping judgements.
In terms of the underlying numbers to the visible faults, Eriksson’s 1.88 goals conceded p/90 (not including penalties) was the worst in the division. Birighitti’s 1.31 p/90 was only behind the Finn, Zach Hemming and Craig Gordon.
However, it should be noted that Eriksson faced an xG of 1.50 p/90, the highest in the division by a distance. That effectively means that he was woefully exposed in his appearances.
“Goals saved above average” (GSAA) is arguably the most useful metric for a keeper, analysing “how many goals did the keeper save/concede versus expectation”. Eriksson, with -0.38 p/90 is, again, the worst in the league.
Birighitti, with a GSAA of -0.18 was middling, better than Eriksson, Jon McLaughlin (-0.35), Hemming (-0.34), Allan McGregor (-0.34) and David Marshall (-0.20).


Conversation