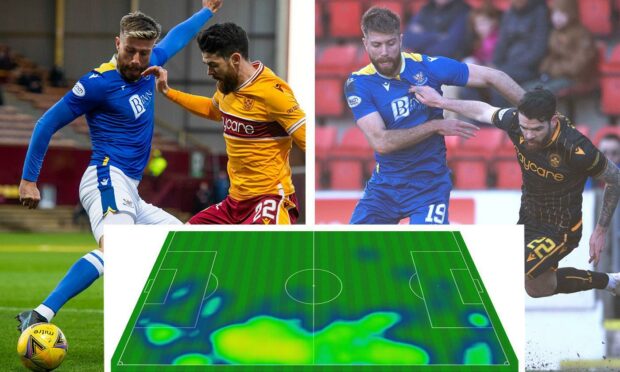
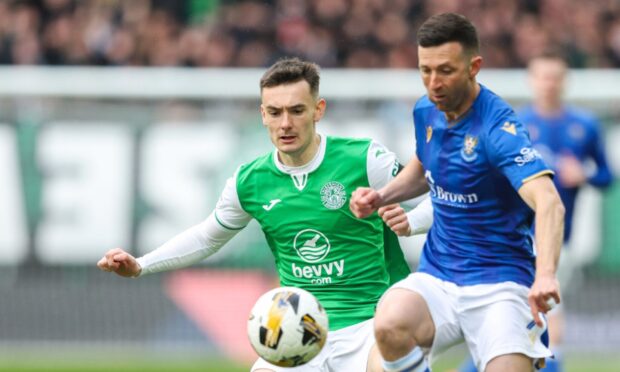
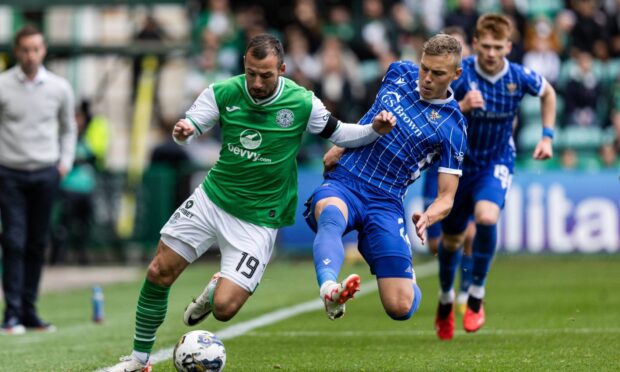
Shaun Rooney’s last game for St Johnstone before a three-month lay-off was a 2-0 defeat to Motherwell.
His first game back was against the same club, this time a precious 2-1 victory.
With the help of Opta statistics, Courier Sport has taken a look at the role Rooney played in the Perth side back in late December compared to the one on his return to assess the development of the team and where he can look to improve in the last few weeks of the season.
All change
Seldom in the history of St Johnstone will the make-up of a first team have changed so drastically in the middle of a campaign and the Rooney v Motherwell then and now perfectly illustrates that.
Only three of the players who lined up with the Hampden hero at Fir Park were in Callum Davidson’s starting 11 a fortnight ago (Zander Clark, Liam Gordon and Jamie McCart).
The midfield and forward line were entirely different.
The formation had also been tweaked from a 3-4-2-1 to a 3-1-4-2.
Higher and wider
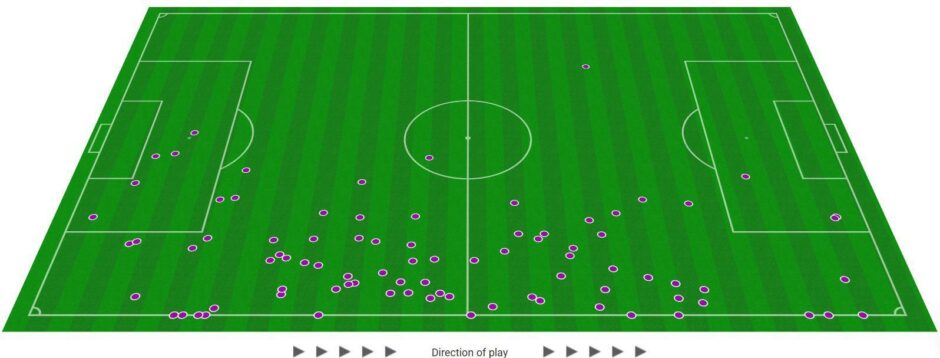
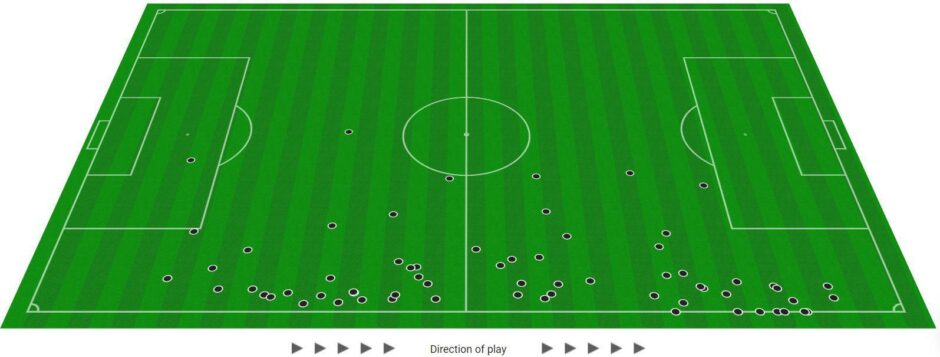
Comparing Rooney’s Opta touch map in the two matches shows that Saints, with less possession at McDiarmid (53% to 58.1%) were more successful in getting Rooney further upfield.
In both games he had 29 touches in his own half but there were 20 more overall in December, making the most recent fixture a much higher percentage in the opposition’s half of the park.
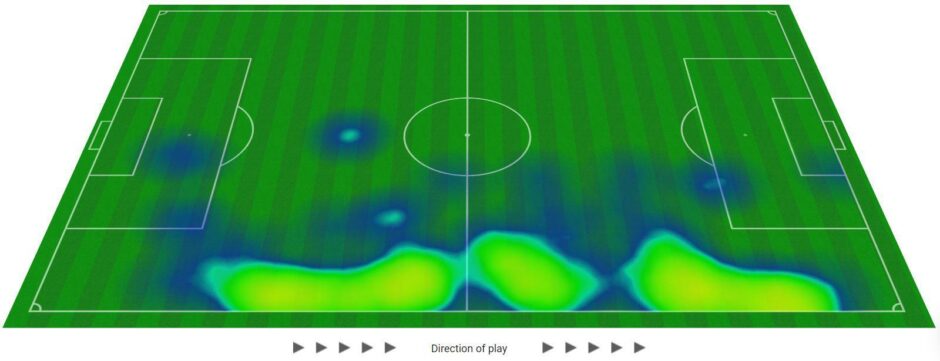
The other eye-catching aspect of the latest Rooney touch map is the width to his game.
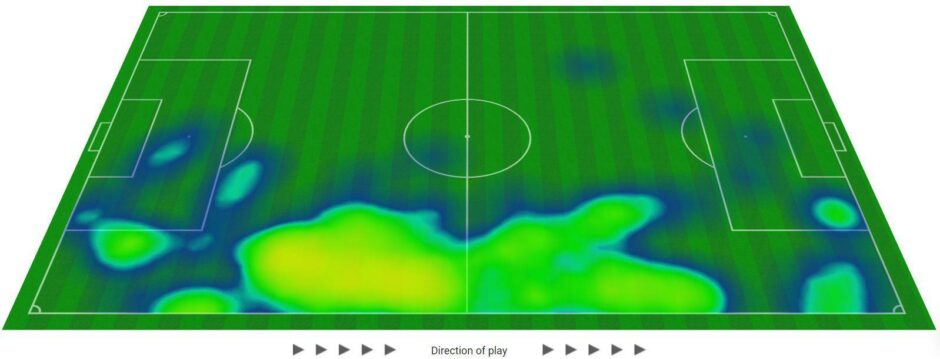
In December he was straying infield more often but he was more disciplined in holding his width last time out.
It’s a point even more effectively illustrated by looking at his two heat maps.
Duelling
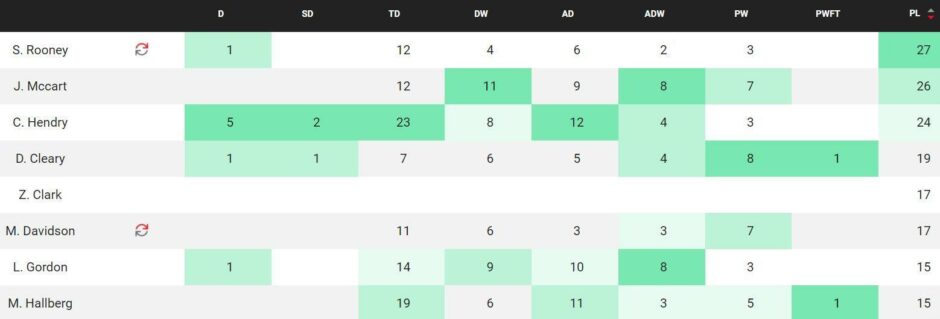
When Saints played Motherwell in December, Rooney was involved in more duels (22) and aerial duels (14) than any other Perth player.
Fast forward a few months and that total dropped to 12 and six.
Six of the starting outfield Saints players won more headers than the imposing wing-back.
There are several aspects to this – one being Rooney wasn’t required to do as much defending in and around his box and another that Saints have become less wedded to the long ball to get them up the pitch while he’s been out of action.
Right over left
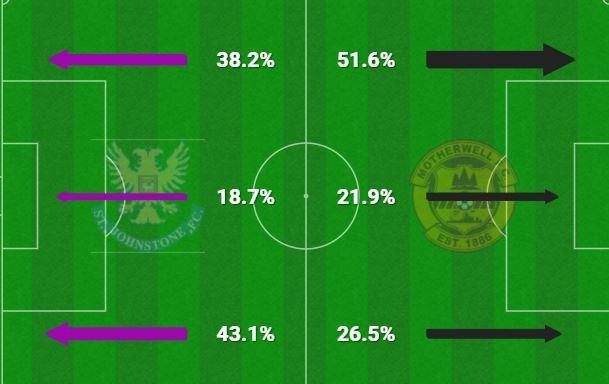
In the first of the games under the spotlight, Saints heavily favoured the left hand side of the pitch as an attacking force.
The combined total of the right and middle at Fir Park couldn’t match the left’s 51.6%.
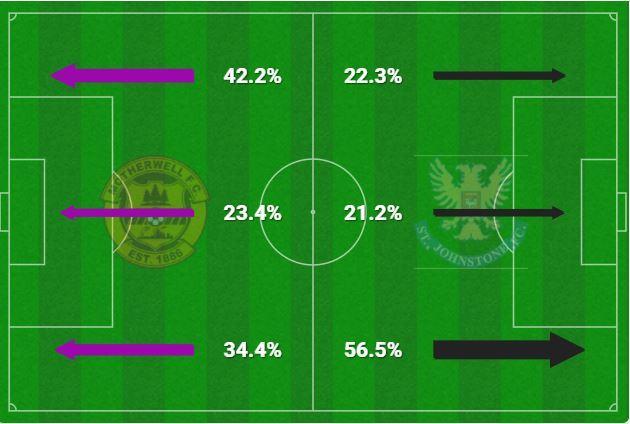
Two Saturdays ago it was a very different story.
Not only did Saints predominantly go down Rooney’s right (42.2% compared to 34.4% left and 23.4% middle), Motherwell did their best to avoid that side as well (56.5% on their right).
The Perth team preferring the right has been a common theme in the 2022 post-break revival.
From the win at Livingston onwards, on every occasion they have taken points from a game the predominant attacking third has been that one.
The influence of Dan Cleary and Melker Hallberg in that area is at the root of this trend.
The Saints team as a whole made 62 final third entries against Motherwell a couple of weeks ago.
And Cleary (highest with 12), Hallberg (nine) and Rooney (eight) contributed to just short of 50% of those between them.
It’s a side of the pitch that has produced several goals – the two at Livingston, Callum Hendry’s openers against Hearts and Ross County, Glenn Middleton’s at Aberdeen and the equaliser versus Motherwell.
And, with Rooney finding his feet again, Saints will surely try to continue reaping rewards from there.
Rooney’s room for improvement
After three months out, expecting anything close to a flawless performance from the double-winner was unrealistic.
All told, it was a comeback to be satisfied with.
The biggest scope for improvement in the remainder of the season (and one of the strongest parts of right wing-back rival Tom Sang’s game) is retaining possession.
Rooney’s passing accuracy in the final third was 47% (compared to Hallberg’s 90%), while he ranked highest in the Perth side for losing the ball (27 times).
You would expect match sharpness, and getting more accustomed to the habits of new team-mates, will ensure those numbers improve significantly.
