Data is a massive thing in modern, 21st century life. Collating information has become hugely important.
Why, even your cuddly old Courier has a data editor these days.
Lesley-Anne Kelly’s brilliant and imaginative logging of the minutiae of the pandemic has been the must-read element of this august organ on a daily basis for some time. Yea, even above some acclaimed columnists.
There’s money to be made
In worldwide sport, data has become a precious currency. Take Pro Football Focus, for example, or PFF as it is commonly known.
It was started in the mid-2000s by an Englishman, Neil Hornsby, who simply wanted to delve deeper into NFL statistics. Initially it was pretty much his hobby, but it quickly grew. By 2014 he employed 13 data analysts and was providing stats for 14 actual NFL teams.
In 2017, Cris Collinsworth, a former player now popular TV analyst, bought a majority share in the company and it moved to the US. Now PFF provides detailed stats for all 32 NFL teams and over 80 teams in college football. The same service is available on subscription for fans, for $200 a year.
The annual revenue of PFF – which also does podcasts, website journalism and is all over YouTube these days – was recently estimated at $40 million. Nice work.
Data starts to become relevant in rugby
American sports are way ahead of us in data, although they do lend themselves to it more than our games do. But it’s become reasonably popular in football and is trying to get a foothold in rugby.
Teams are now getting detailed data on play trends. This is why we see so many kickable penalties knocked into the corner these days – the stats show it’s a much more effective way of getting points.
Stats are being chucked at us from all-comers at Six Nations time. This week, Opta told us Stuart Hogg surpassed Italy’s Sergio Parisse for the most metres made by a player since the championship enlarged in 2000.
3091 – @Scotlandteam captain @StuartWHOGG_ gained 88 metres with ball in hand against England, taking him past @sergioparisse (3,088) as the player to gain the most in @SixNationsRugby history (3,091). Pole. pic.twitter.com/s264lkuSX5
— OptaJonny (@OptaJonny) February 8, 2021
One legend of the 6N passes another. It’s a decent headline and they are both unquestionably great players. But hold on a minute.
Of course Hoggy was always going to pass Sergio, eventually. Hogg is a full-back who customarily fields long kicks in acres of space and runs quite a few of them back. He gets many cheap metres simply by playing at 15.
Parisse has played more games in the 6N than anyone – 69, while averaging 44 metres a pop. That’s really good for a No 8 in international rugby, especially for a perennially struggling team.
But for much of Sergio’s career the customary tactic was to retreat the No 8 to catch and return box-kicks. More cheap metres, at least until some bright spark realised box-kicks could be chased and contested.
It looks impressive, but the context, and why that might skew the impression given by the bare figures, is missing. This happens a lot in rugby stats.
The stats from the Calcutta Cup
This week I got an email from QBE, the insurance group who are dabbling in rugby stats. They studied the Calcutta Cup game at the weekend and had a few observations.
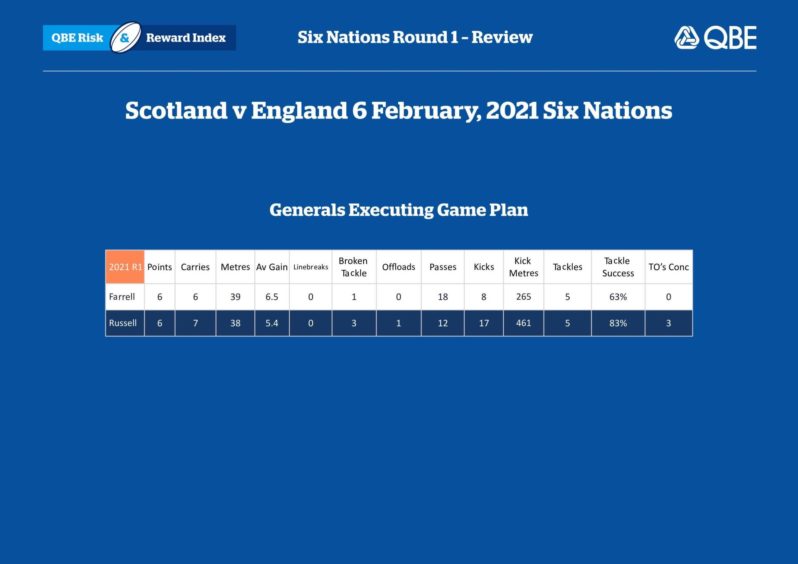
The first one they highlighted was surprising – Finn Russell kicked much more than Owen Farrell. They had roughly similar ball in hand (Russell 36 times, Farrell 32), but Finn kicked 17 times and Farrell just eight.
This is interesting (well, it is to me) because one of the primary criticisms of Farrell is he kicks too much, while Russell is considered a ball player. Yet Finn kicked twice as often.
Again, there’s no context. Some of Farrell’s kicks, illustrated in twitter memes that went viral amongst England’s support, were with two or three man overlaps outside him. WHEN he kicks as much as how much is relevant.
Just a reminder that Owen Farrell chose to kick this 6 on 2 on Saturday. #Shambles #SixNations #EnglandRugby pic.twitter.com/dtDTrX6GLC
— Nathaniel John (@Nathaniel_John) February 8, 2021
But that stat is still a good one, in my opinion, as it turns conventional thinking on its head and gets people thinking.
In the Red Zone
Another QBE stat in the email, however, I think is dead wrong. It stated Scotland’s efficiency in the 22 – the “red zone” – won them the game.
Scotland’s Red Zone efficiency of 0.69 (points per visit, I assume) was more than twice England’s 0.27. But it was still awful, and actually almost cost them the game.
The Scots were in the Red Zone 16 times, for 11 points. That’s just poor by any measurement, and any Scottish fan watching the game spent the last half hour terrified that such profligacy was going to come back on them.
Had Scotland been really good in the Red Zone, the score would have been 24-6, or something similar. On the balance of play – and you didn’t need any stats to see it – that would actually have been a fair scoreline.
Against a properly efficient team in the Red Zone – hello Ireland – this is going to really hurt Scotland if it’s a continuing trend.
We’re just getting started…
What the Red Zone stats showed us, I think, is that both team’s defences at Twickenham were really good. Again, that’s an element of the data that’s left aside, but it’s surely hugely relevant.
Data interpretation is in its infancy in rugby. Even in sports where it’s established, it’s still being tweaked. PFF seem to come up with a new measurement on almost a weekly basis as they deep think their data.
It engenders debate, which is always a good thing. But handle the stats with care.


