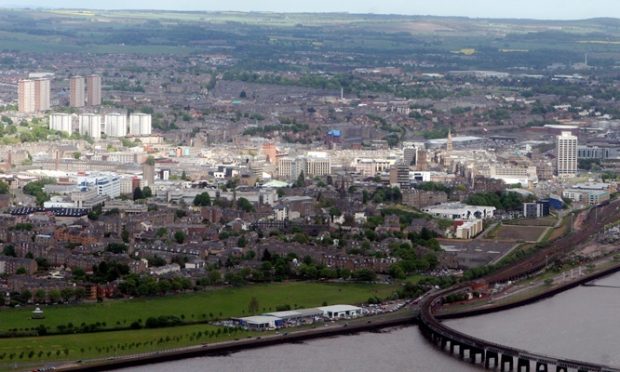
Despite the turbulent economy, it appears living in Dundee and Angus is good if you want to treat yourself.
A new UK-wide study reveals the area boasts one of the highest average disposable income rates in the country.
Dundee residents have £11,871 to spend after outgoings such as tax, mortgage payments and pension contributions, whereas for Angus the figure is slightly more at £14,316.
Topping the chart, which contains 50 locations, was Aberdeen.
Accounting group UHY Hacker Young, which carried out the research, said Aberdeen’s success was buoyed by a “booming oil industry”.
Partner Marc Waterman said: “London has been seen as streets ahead of all the other UK towns and cities for growth in disposable household income, but these figures show that the gap is closing.
“Although London still has the greatest disposable income in the UK, Aberdeen is catching up fast.”
Mr Waterman said Aberdeen has benefited from persistently high oil prices.
He continued: “Despite the recent North Sea tax increases, there has been continued investment in North Sea oil and gas production.
“Although disposable incomes in Dundee and Glasgow have grown from a low base, the growth has been very rapid, aided by their low housing costs and the fact that they avoided the worst of a spike in unemployment.
“However, with more public sector budget cuts on the way, growth in disposable income may moderate or reverse for some towns that are heavily dependent on public sector employment,” he added.
In 2004, people living in the Aberdeen area had £13,669 left over and this figure has leapt by 24.65% over five years to £17,039.
London came in second place in terms of percentage change but had the highest disposable income overall. The capital saw a 22.13% jump over the same period, with households pocketing £19,658 in 2009, compared with £16,096 five years earlier.
Here are the top 20 towns and cities by disposable household income increase over the five years from 2004 to 2009 (urban sub-area 2009, 2004 % change):1 Aberdeen City and Aberdeenshire £17,039, £13,669, 24.65%; 2 London £19,658, £16,096, 22.13%; 3 Stoke-on-Trent £12,097, £9,987, 21.13%; 4 Glasgow City £13,571, £11,250, 20.63%; 5 Angus and Dundee City £14,316, £11,871, 20.60%; 6 Monmouthshire and Newport £14,887, £12,360 20.44%; 7 Belfast £14,383, £12,057, 19.29%; 8 Sunderland £12,196, £10,236, 19.15%; 9 Bournemouth and Poole £16,239, £13,756 18.05%; 10 Preston £13,697, £11,627, 17.80%; 11 Maidstone £15,995, £13,621, 17.43%; 12 Newcastle-upon-Tyne £13,138, £11,189 17.42%; 13 Liverpool £12,456, £10,617, 17.32%; 14 Blackpool £12,199, £10,427, 16.99%; 15 Telford and Wrekin £13,151, £11,252, 16.88%; 16 Swansea £13,447, £11,522, 16.71%; 17 Northamptonshire £15,247, £13,069, 16.67%; 18 Edinburgh £17,160, £14,767, 16.21%; 19 Peterborough £14,235, £12,278, 15.94%; 20 Ipswich £14,913, £12,868, 15.89%.
