Calendar An icon of a desk calendar. Cancel An icon of a circle with a diagonal line across. Caret An icon of a block arrow pointing to the right. Email An icon of a paper envelope. Facebook An icon of the Facebook "f" mark. Google An icon of the Google "G" mark. Linked In An icon of the Linked In "in" mark. Logout An icon representing logout. Profile An icon that resembles human head and shoulders. Telephone An icon of a traditional telephone receiver. Tick An icon of a tick mark. Is Public An icon of a human eye and eyelashes. Is Not Public An icon of a human eye and eyelashes with a diagonal line through it. Pause Icon A two-lined pause icon for stopping interactions. Quote Mark A opening quote mark. Quote Mark A closing quote mark. Arrow An icon of an arrow. Folder An icon of a paper folder. Breaking An icon of an exclamation mark on a circular background. Camera An icon of a digital camera. Caret An icon of a caret arrow. Clock An icon of a clock face. Close An icon of the an X shape. Close Icon An icon used to represent where to interact to collapse or dismiss a component Comment An icon of a speech bubble. Comments An icon of a speech bubble, denoting user comments. Comments An icon of a speech bubble, denoting user comments. Ellipsis An icon of 3 horizontal dots. Envelope An icon of a paper envelope. Facebook An icon of a facebook f logo. Camera An icon of a digital camera. Home An icon of a house. Instagram An icon of the Instagram logo. LinkedIn An icon of the LinkedIn logo. Magnifying Glass An icon of a magnifying glass. Search Icon A magnifying glass icon that is used to represent the function of searching. Menu An icon of 3 horizontal lines. Hamburger Menu Icon An icon used to represent a collapsed menu. Next An icon of an arrow pointing to the right. Notice An explanation mark centred inside a circle. Previous An icon of an arrow pointing to the left. Rating An icon of a star. Tag An icon of a tag. Twitter An icon of the Twitter logo. Video Camera An icon of a video camera shape. Speech Bubble Icon A icon displaying a speech bubble WhatsApp An icon of the WhatsApp logo. Information An icon of an information logo. Plus A mathematical 'plus' symbol. Duration An icon indicating Time. Success Tick An icon of a green tick. Success Tick Timeout An icon of a greyed out success tick. Loading Spinner An icon of a loading spinner. Facebook Messenger An icon of the facebook messenger app logo. Facebook An icon of a facebook f logo. Facebook Messenger An icon of the Twitter app logo. LinkedIn An icon of the LinkedIn logo. WhatsApp Messenger An icon of the Whatsapp messenger app logo. Email An icon of an mail envelope. Copy link A decentered black square over a white square.

PM’s constituency in top 10 of water pollution ranking, investigation finds

People enjoy hot weather at Richmond Falls on the River Swale, North Yorkshire (Owen Humphreys/PA)

Rishi Sunak is running for a constituency that has ranked in the top 10 for potential water pollution, an investigation has found.

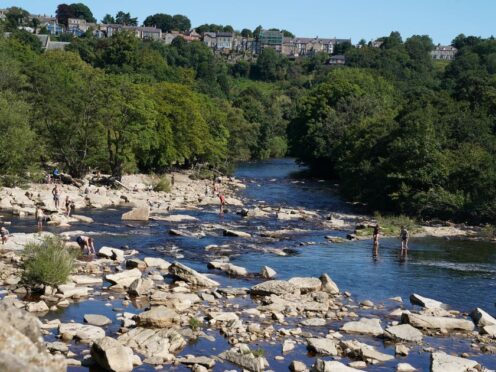
Richmond and Northallerton – a new constituency in North Yorkshire following boundary changes – ranked ninth in data analysis by investigative journalism platform Watershed.

Mr Sunak was previously MP in the old Richmond (Yorkshire) constituency, which has now been split mostly into Richmond and Northallerton, with some of the original area going to Thirsk and Malton.

Researchers gathered data on UK waterways from official sources such as the Environment Agency as well as water companies and its own water testing.

The figures cover pollution risks from sources like sewage spills, nitrates, contamination from landfill sites and levels of PFAs – known as “forever chemicals” due to the long time they take to break down in the environment.

Map of Great Britain which shows tens of thousands of pollution threats gathered from several sources of data
The map has tens of thousands of pollution threats gathered from several sources of data (Watershed/PA)

The researchers then combined these into a major interactive map that shows tens of thousands of ecological and chemical threats to individual waterways, rivers, coasts and lakes across Great Britain.

They also calculated a standardised “environmental health score” for each constituency based on the pollution threats indicated by the analysis.

The majority of the top 10 constituencies for poor environmental health were located in the north of England, according to the findings.

Thirsk and Malton in North Yorkshire, Penrith and Solway in Cumbria and Central Devon came joint highest, followed by Tatton in Cheshire in fourth.

Newton Aycliffe and Spennymoor in County Durham, and Skipton and Ripon in North Yorkshire came in joint fifth.

In joint seventh was Selby and Wetherby and Easingwold – also in North Yorkshire, followed by Richmond and Northallerton in ninth and Chester South and Eddisbury in Cheshire in tenth.

The scores were adjusted for population and constituency size so that areas with more rivers or surface area were not unfairly penalised for being bigger than others.

Researchers said the map and data will continue to evolve over time, adding it currently may not show a complete picture.

Map showing bathing water quality areas across Great Britain
The map covers coastal areas, lakes, rivers and waterways across the UK (Watershed/PA)

Some constituencies may have scored better – due to having little or no scores in some of the areas of measurement – such as not being a nitrate vulnerable zone, no sampling of PFAs having taken place in the area, or having no river length at all.

For this reason, many London boroughs scored well in the water pollution rankings, the researchers noted.

The map has been published with a week to go before the General Election on July 4.

Britain’s water pollution crisis has become a major topic during the campaign, with the Labour Party and the Liberal Democrats ramping up attacks on the “Conservative sewage scandal” last week.

Anger has been growing over the polluted state of England’s rivers and coasts in recent years, with no single stretch of river classed as being in a good overall condition, and hundreds of pollution risk alerts issued for popular beaches around the country last year.

Data from the Environment Agency for 2023 shows a 54% increase in the number of sewage spills compared with 2022, and a 13% increase compared with 2020.

The map can be found at:

The Watershed Pollution Map

PA contacted the Conservative Party for comment.